
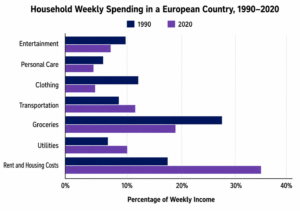
The bar chart below shows how households in a European country spent their weekly income in 1990 and and in 2020. Summarise the information by selecting and reporting the main features, and make comparisons where relevant.
Type your essay below and click Submit for evaluation
You have 20:00 minutes to complete Writing task 1. The timer will start when you start typing.
Words Count:
0

